Contracts signed dropped in 2014 in Monmouth County shore towns
Monmouth County’s shore towns of Avon-by-the-Sea, Belmar, Spring Lake, Sea Girt and Manasquan are the towns in Monmouth County most closely identified as being affected by the vacation housing market.
One of the traditional measures of demand for housing is the number of properties that go under contract. The willingness to purchase a second or vacation home is a big indicator of to what degree the local economy is recovering; purchasing a second home is a big financial venture, one that families are unlikely to undertake in uncertain times.
It’s Labor Day weekend, a ripe time to analyze the change over time of this particular measure of these local markets and the local economy.
An analysis revealed the following data:
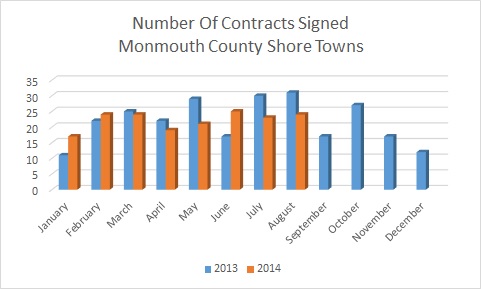
The data reveals of the 8 months so far in 2014, only 3 months experienced more contracts signed than in the same month in 2013. There could be a myriad of reasons for what’s been observed. First off, 2013 was an anomaly year for the NJ shore as it wrestled with a recovery from Hurricane Sandy. Sandy affected the market heavily, in the form of physical damage to properties, and a high degree of uncertainty in the area due to the possible effects of future flooding and revised FEMA flood maps and rates. One could hypothesize that this played a role in the changes we’ve seen as investors scooped up damaged properties being sold by distressed sellers at discounted prices, causing a greater than normal number of properties to be sold. Let’s take a look at an indicator of inventory levels:
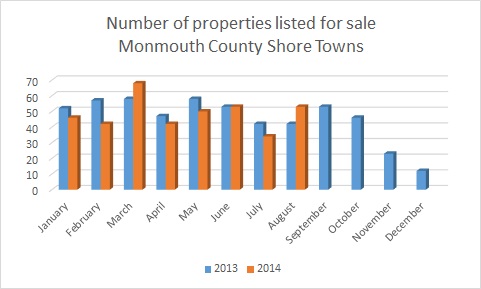
This chart shows the number of new listings initiated on a month by month basis. First off, it’s a fact that November and December see little in the way of new listings due to a family holiday focus and approaching winter during this time of year. In the first three months of 2014, we saw January and February’s new listings below the prior year and a surge of listings in March. It is reasonable to attribute this to unusually harsh winter conditions in January and February of 2014, the likes of which were prohibitive to selling a home. Setting aside these 3 months, the number of new listings was not convincingly different.
Some things to be observed from these 2 charts:
– There was a surge of new listings in March of 2014 which was not followed by a surge in contracts signed.
– The year over comparison of number of new listings initiated was not convincingly different, meaning the drop in sales can’t be explained away solely due to a lack of available inventory.
– For the most part, demand for shore/vacation homes in Monmouth County failed to show any type of significant or notable strengthening on a large scale.
All this points to some unresolved issues in the second home market in shoreline Monmouth county.

